

The Texas A&M RELLIS is a 1,900 acre research campus located in northwest Brazos County, Texas, on the banks of the Brazos River. The site was originally founded in the late 1940s as an Army Air Corps training base. It was decommissioned and given to the State of Texas. From there, it was deeded to the Texas A&M University System (TAMUS) and called Riverside Campus. The campus was rebranded as the RELLIS Campus, the acronym for Texas A&M’s core values (respect, excellence, leadership, loyalty, integrity, and selfless service).
 The TAMUS sought to redevelop the RELLIS campus to provide venues for public and private research opportunities. In order to allow for development of modern teaching and research practices, the campus needed new infrastructure and utilities. The initial scope provided by TAMUS was conceptual layouts overlaid on commercially available satellite imagery. The redevelopment included new and rehabilitated streets, drainage ditches and structures, hydronic water lines for heating and cooling, domestic water, sanitary sewer, electric and communications duct banks, and gas lines. The civil engineering portion of the redevelopment included analysis and design of approximately 4.5 miles of streets and drainage features, 6,200 LF each of domestic water and hydronic (hot and chilled) water supplies and returns, 4.1 miles of electric and data duct banks, 3,400 LF of sanitary sewer lines, and 5,000 LF of gas lines.
Challenges: Multiple End Users, Timeline, Accuracy
Multiple End User Goals
The objectives for the campus improvements were developed based on specific interests of future end users. These objectives dictated the design requirements of the infrastructure and drove the schedule. TAMUS made commitments for the delivery of available utilities and infrastructure to the public and private end users scheduled to open facilities at the campus. The end users at RELLIS included private businesses doing research and development, TAMUS entities providing academic and research facilities, and third party public higher educational institutes committed to providing additional academic and workforce training. If the necessary infrastructure was not available to serve these facilities, the TAMUS would suffer significant contractual and political impacts.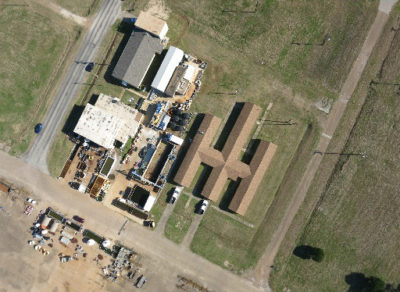 Aggressive Timeline/ Schedule
Initially the overall project scope required nine to twelve months of design, beginning with the approximately 3 months of survey field work and data processing necessary for engineering analysis and design to begin. The overall size of the subject site and the extensive scope of the improvements dictated that the survey work be very detailed. Weather was a factor that could interfere with the survey team’s ability to finish the field work in a timely manner.Data Accuracy
The design team needed site information to begin preliminary lay outs and designs. This information needed to be as accurate as possible to ensure that the design could move forward seamlessly as soon as the preliminary designs were approved. Any redesign associated with adjustments to field conditions would mean crucial design delays that the project schedule could not absorb.Solution and Results
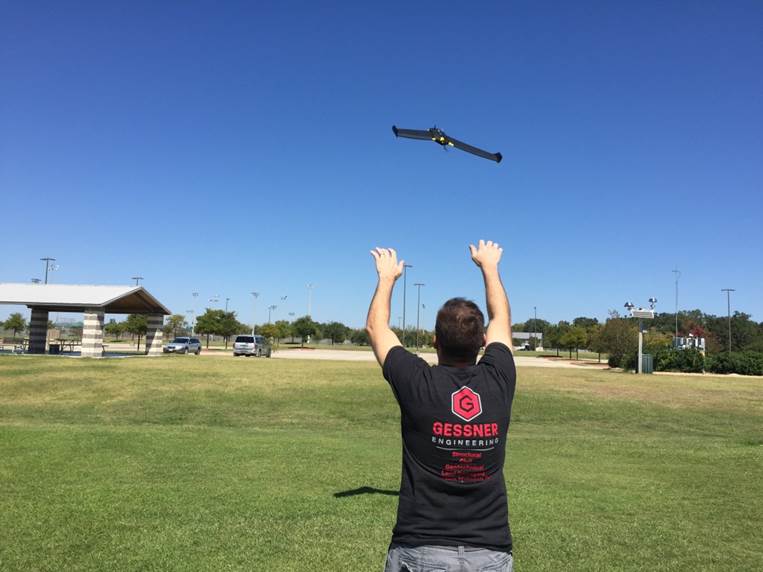
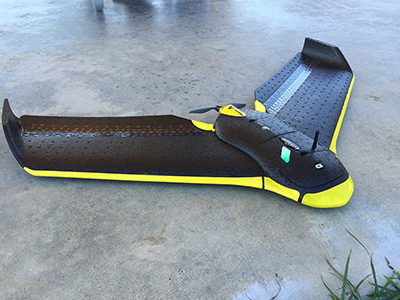
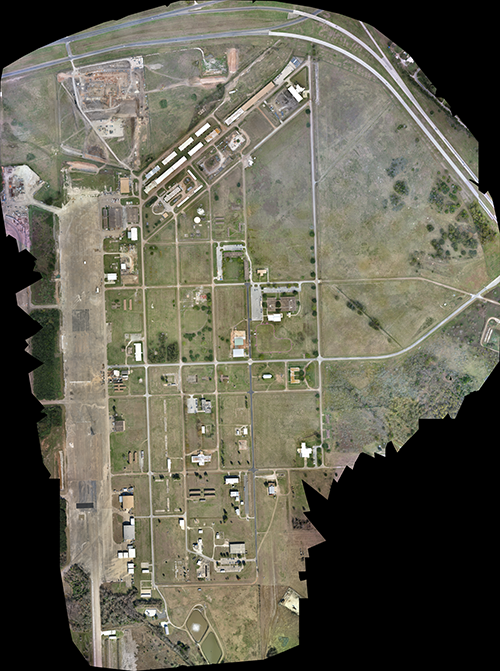
“The senseFly eBee was an invaluable tool on this project. The speed at which it was able to obtain information allowed us to commence construction 6 weeks earlier than anticipated.”-Vaughn ConstructionThe initial phase of the project scope was approximately 800 acres in area, and the total flight time for this area was about 6 hours. This time included the necessary pre-flight in the field and battery changes between flights. The weather conditions also effected the time, as windy conditions require longer flight times and use more power. After the flight, the data was downloaded and the processing began. The flight data was processed using Pix4D and photogrammetric models were produced. Using a custom built computer (6 core multi-threaded processor, 64 GB memory, 512 GB SSD hard drive, 2 – 8 GPUs, liquid CPU cooler, 8 – 120 mm fans), the model took 10 hours to process and generated a point cloud with 119,062,073 points. The data included 1,807 images over an area of 760 acres, and the final resolution was approximately 1.6 square inches per pixel. The conventional topographic survey would have taken three months and only generated one point every 10 feet.During the data processing, the horizontal and vertical coordinates were input for each of the ground control points. The Pix4D software used the GCPs to adjust and map the orthometric aerial data and generate a point cloud. The point cloud was brought into Civil 3D and used to create an existing surface model. The aerial imagery was georeferenced and brought into the Civil 3D model as well. The 4x6 foot aerial image of the campus was delivered in various form to the owner and end users for use in planning, presentations, and monitoring progress of the design. Using the topographic data and aerial imagery, the initial layouts for streets, ditches, and utilities commenced. The initial data was on the correct project coordinate system. This provided the engineering team with consistency from the preliminary design through the final delivery of the construction documents. The team delivered initial design layouts within 2 weeks of the project starting due to the data available from the UAS.During the preliminary design phases, conventional field work was gathered as well. As the additional field work was collected, it was integrated into the overall survey and point clouds.
“The success of this redeveloping campus depends on the Central Utility Plant, Infrastructure and Roadway project being constructed and operational on time and in budget. This critical path project will not succeed without using the capabilities of a drone to start right after the execution of our contract. The ability to design while still documenting the existing conditions almost in real-time, allowed our client, general contractor and design team to make critical design and cost decisions early in the process to expedite construction documentation. By using the drone our civil engineer was able to start the design, which gave useful backgrounds to the rest of the A/E team, while our construction partner was able to do cost estimates off known values, not just an aerial overlay. We were able to save more than 3 months of design and documentation time just on the civil and infrastructure package alone. Our original deadline for CD’s was in July, and we were issuing the first package in January with the final package in middle March. Pretty awesome!”-Ruben DeLaO - Senior Project Manager - Energy Architecture
 The conventional field data verified the photogrammetric data. The streets and drainage ditches were designed based on the topographic data obtained through photogrammetry and verified conventionally. These included performing the hydrologic and hydraulic analysis based on the proposed and existing site conditions. Plan/ Profile sheets and designs for streets and drainage ditches were produced. The documents achieved the goal for the design team to deliver design documents to allow the contractor to develop a guaranteed maximum price (GMP) for the project.The eBee UAS allowed for the land surveying resources to be maximized and increased the team’s efficiency. The use of the eBee system allowed the design and analysis to commence ahead of schedule, and allowed the civil engineering team to provide the rest of the design team and the owner accurate representations of the field conditions.In a similar way, designs were produced for the underground infrastructure, including domestic water, hydronic water supplies and returns for hot and chilled water, electric and data duct banks, and sanitary sewer lines. The plan/profiles sheets were produced for these designs, which allowed the design team to move forward with the overall design.Additionally , during the field surveying phase, ground penetrating radar (GPR) was used to verify underground utility locations, depths of bury, and sizes of lines. This data was integrated with the field survey data and UAS data obtained by the eBee to provide 3D representations of the ground surface and subsurface conditions. These models proved valuable in design, analysis, and document production for the scope of the project. The 3D models and aerials available to the design team and owner allowed for detailed planning and coordination during design, as well as for future master planning.
 Plan, Design, Verify
The senseFly eBee enabled the acquisition of topographic data in a quick and uncomplicated manner. The data was verified to be accurate, which allowed for the early commencement of design documentation. By providing real time imagery, the proposed infrastructure improvements couldbe coordinated with the existing conditions as well as future master planning proposals. The nature of the project dictated that design decisions be based on future needs as well as current conditions. The data provided through the UAS system allowed for determinations based on all of these factors.The UAS was an invaluable tool on this project. The speed at which it was able to obtain information pushed the project time-line forward. The level of data generated through the process enabled preliminary and GMP design document production to ensure budget conditions and not delay the commencement of construction. Without this tool and the data provided, the chances of meeting the project timelines would have been significantly diminished.Additional Information
Gessner Engineering, LLC has been solving problems using engineering principles since 2003. Our headquarters are in College Station and our growthhas afforded us the opportunities to add offices in Fort Worth and San Antonio. We provide Civil, Structural and Geotechnical Engineering, Land Surveying and Construction Materials Testing. This gives us the unique advantage of having direct access to in-house experts who contribute to the various stages of a project. The collaboration that happens as a result has proven to be a benefit to the team members as well as our clients.

.jpg.small.400x400.jpg)


Comments